
Pricing


LinkedIn Analytics Guide 2026: Metrics, Fixes & Tools That Actually Work

September 12, 2025

19
min read


Key Takeaways
- LinkedIn reaches 1.1 billion members but its native analytics are unreliable: with 310 million monthly active users and a 5% average company page engagement rate, users still face mismatched dashboard vs CSV numbers, missing click counts, no hourly trends, and demographics hidden below roughly 25 views.
- Three metric groups actually drive revenue: content performance (impressions, engagement rate, CTR, video view rate), audience metrics (follower growth, demographics, Search Appearances, SSI), and business metrics tracked outside LinkedIn via UTM tags, Google Analytics 4 referral traffic, and CRM-connected leads.
- Good engagement rates vary by industry: company pages average around 5%, B2B SaaS and tech run 3.5-5%, professional services 5-6%, education and non-profits 6-8%, carousels reach up to 6.6%, video sits at 3-4%, and personal profiles range 2-6%.
- The CSV export is the single source of truth: LinkedIn's dashboard shows a rolling 30-day view while exports list lifetime totals, and API latency delays exports 24-48 hours, so final reports should be pulled two days after month end.
- A 4-step monthly workflow keeps LinkedIn data reliable: pull the CSV on the 1st, reconcile it against the dashboard, check the funnel in GA4 (Acquisition then Traffic Acquisition, filtered to LinkedIn), then review the top three and bottom three posts to shape next month's plan.
- Paid tools fix native gaps from $39/month: Taplio adds real-time data, hourly trends, multi-profile tracking, and extended history versus LinkedIn's roughly 12-month company page limit, with Shield strong for individual creators and Keyhole for hashtag and keyword tracking.
The first time I tried to analyse my LinkedIn performance, I thought it would be simple. Then I opened the dashboard, exported the CSV, and realised the numbers didn’t match. Whatever it be impressions, clicks or even engagement, nothing seemed consistent. If you want a clear picture of what's normal, our LinkedIn Benchmark breaks down average reach, engagement, and performance by follower count every month.
A quick search on Reddit and Quora confirmed it was not just me. Marketers, creators, and B2B teams all run into the same issues: mismatched data between views and exports, missing click counts, no hourly trends, and demographics that vanish if a post doesn’t hit 25 views.
This is surprising when you consider LinkedIn’s scale. The platform now has 1.1 billion members, 310 million monthly active users, and an average company page engagement rate of 5%. With numbers like that, you’d expect analytics to be rock solid. But they’re not, and that’s exactly why so many professionals turn to third-party tools and community-shared workarounds.
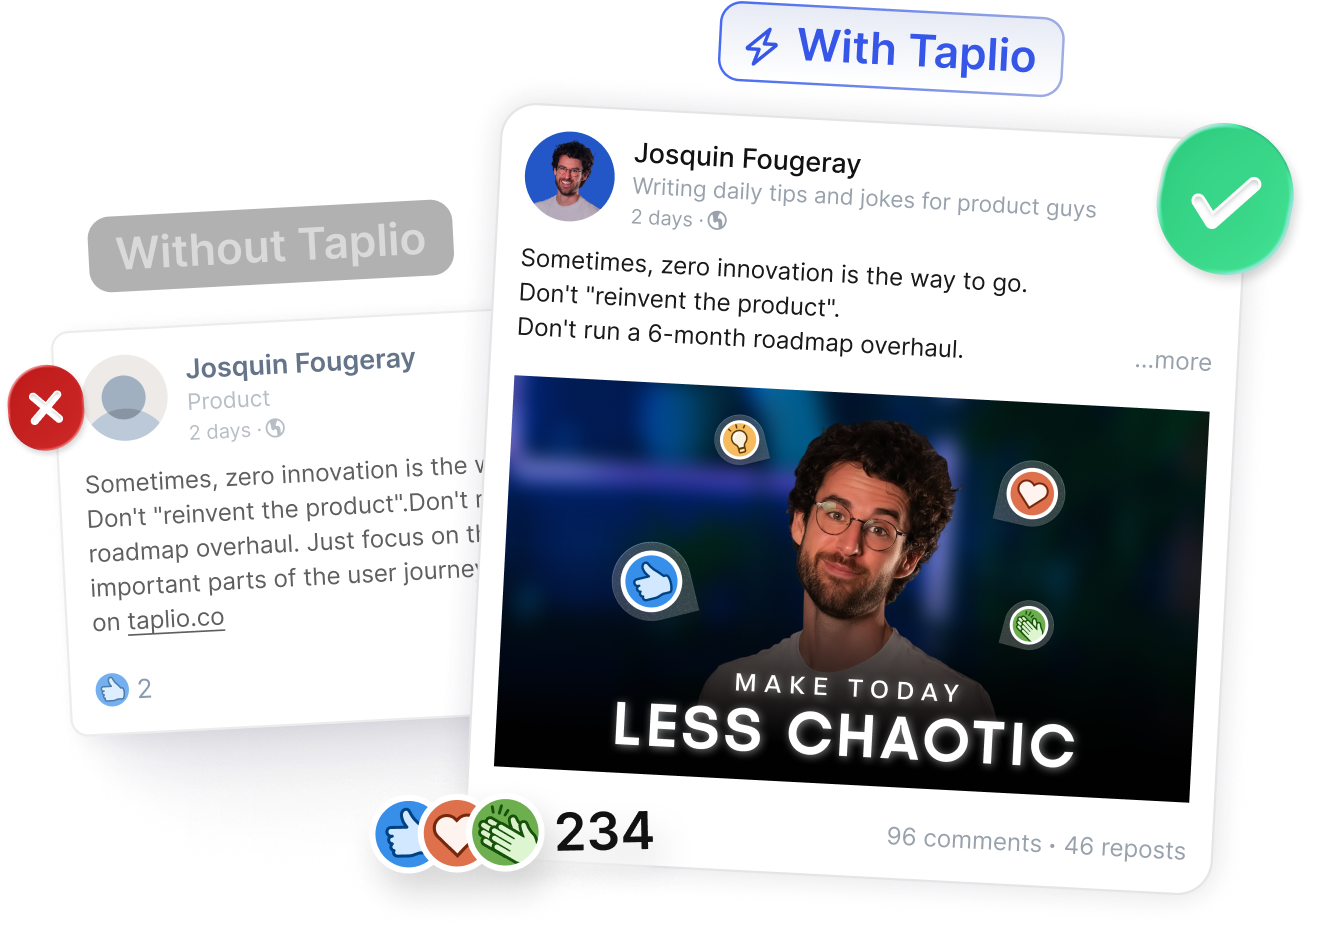
In this guide, I’ll show you how I make LinkedIn analytics work for me despite its flaws. You’ll see the exact metrics I track and the ones I ignore. I will explain the proven methods that make my reports accurate and actionable. In addition, I will show you how to use Taplio tools to save hours of manual checking so that I can focus on content that drives results.
Your complete LinkedIn analytics tour in 2 minutes
Most people never explore the full depth of LinkedIn’s analytics. Yet knowing exactly where to look can save hours of confusion and help you focus on the numbers that matter. Whether you are analysing a personal profile or managing a company page, the key is to understand what each metric represents and where to find it.
For Personal Profiles (Creator Mode & Standard)
On your profile, scroll to the “Analytics” section. If you have Creator Mode on, this will be more prominent. Here you will see three main metrics.
- Profile Views shows how many people have looked at your profile in the selected time frame. It is useful for tracking visibility after posting or networking activity.
- Post Impressions counts how many times your posts have been displayed on someone’s feed. It is a reach metric, not an engagement metric.
- Search Appearances tells you how often your profile appeared in search results, which can indicate demand for your skills or expertise.
To see post-level data, go to any post and click “View analytics”. This will reveal impressions, reactions, comments, shares and the “number of members reached” figure, which is the actual unique audience size.
For Company Pages
From your company page, click on the “Analytics” tab in the top menu. You will find several sub-tabs.
- Content shows performance metrics for all posts, including clicks, click-through rate and engagement rate.
- Visitors provide data on who is visiting your page, including job titles, locations and company sizes.
- Followers track your follower count over time and offer demographic insights.
- Competitors lets you compare your page’s performance to others in your industry, including post frequency and engagement.
- Employee Advocacy shows how posts shared by employees are performing, which is key for organic reach.
Track the 3 LinkedIn metrics that actually drive revenue
When I first started tracking my LinkedIn analytics, I made the same mistake as everyone else. I watched every number LinkedIn gave me (impressions, clicks, reactions) without asking which ones actually mattered for my business. It took months of trial and error to realise that only a handful of metrics truly showed if my content was leading to conversations, leads, or sales.
- Core Content Performance Metrics
The first group tells me how my posts perform in the feed:
- Impressions show how many times my post was displayed.
- Engagement rate measures how people interact with it. LinkedIn calculates it by adding interactions, clicks, and new followers, then dividing by impressions.
It looks good on paper, but I’ve learned it can be misleading. A post with 200 likes and no link clicks doesn’t help if my goal is driving traffic. That is why I also track Click-Through Rate (CTR) and Video View Rate. CTR tells me how many people took action after seeing the post, while Video View Rate shows if my videos actually hold attention beyond the first few seconds.
- Audience metrics that can help optimise posts
These help me understand who I’m reaching and how to adapt my content. I look at which post types perform best for my audience, then compare follower growth and visitor demographics. It’s also where I check Search Appearances to see how often I show up in LinkedIn searches, and my Social Selling Index (SSI) for a rough measure of networking impact.
One thing I’ve learned the hard way: demographic data only appears once a post hits around 25 views. If you see “Not enough data,” it’s not a bug, it’s the threshold.
- Business metrics LinkedIn hides from you and how to track them
The real revenue story is often outside LinkedIn. I track referral traffic in Google Analytics 4 by filtering for “linkedin.com” as the source. Every link I share has UTM tags so I know exactly which post brought in a lead.
If I’m running ads, I calculate Cost Per Lead in Campaign Manager. ROI only makes sense once I connect those leads to actual revenue, which means integrating LinkedIn data with my CRM.
Newsletter metrics
An extra metric worth tracking is the newsletter engagement. If you publish newsletters on LinkedIn, your subscriber count is only part of the story. I also watch open rates and click rates. They show me not just how many people read my content, but how many take the next step. For me, it’s often a sign that the topic resonated enough to drive action, which is the same reason I track CTR on regular posts
Bonus – Taplio dashboard
I used to do all this manually, switching between LinkedIn, GA4, and spreadsheets. Now, Taplio’s LinkedIn analytics tool gives me a single view of my performance. I can see which posts actually bring results, spot the best times to post, and plan content without spending hours on reports.
What is a good engagement rate on LinkedIn in 2026?
One of the first questions I hear when talking about LinkedIn analytics is, “Is my engagement rate good?” The short answer is that it depends on your industry, audience size, and the type of content you post. The longer answer is that you need to compare your numbers to real benchmarks.
Across all industries, LinkedIn company pages average around 5% engagement rate in 2025. This means that out of every 100 impressions, about five lead to an interaction such as a like, comment, share, or click. But that number shifts depending on your sector and content style.
Here’s what recent benchmark studies, including Socialinsider’s 2025 data, suggest:
- B2B SaaS and Tech: 3.5% to 5%
- Professional Services: 5% to 6%
- Education and Non-profits: 6% to 8%
- Multi-image posts or carousels: up to 6.6% on average
- Video posts: typically 3% to 4% but can outperform with strong storytelling
From my own experience, I’ve learned that engagement rate should not be the only measure of success. A post with a lower engagement rate but high CTR or lead conversions can be far more valuable than one packed with likes.
By the way, the engagement rate on LinkedIn profiles go from 2 to 6%.
When you review your engagement, always pair it with other metrics such as click-through rate, follower growth, or lead generation. That way, you’re comparing yourself not only to industry averages but also to your own business goals.
Should you upgrade from free LinkedIn analytics?
LinkedIn’s free analytics give you a basic overview of performance. For personal profiles and small company pages, that can be enough to get started. But if you want deeper insights, faster reporting, or multi-profile tracking, you will quickly run into its limits. This is where paid tools, including Taplio, can make a big difference.
Native LinkedIn vs. Taplio vs. Other Paid Tools
Feature Native LinkedIn Taplio Other Paid Tools (Shield, Keyhole, Metricool) Real-time data No Yes Some (depends on tool) Hourly trends No Yes Yes Multi-profile view No Yes Yes Data accuracy/reconciliation Basic, prone to mismatches Reconciles metrics from multiple sources Varies, some require manual exports Historical data limit ~12 months for company pages, less for personal Extended historical archive Varies (some up to 3 years) Cost Free From $39/month $29–$99+/month
From my own experience, the main difference is speed and clarity. Native LinkedIn is fine for quick checks, but if you manage multiple profiles or report to clients, reconciling numbers becomes a time sink.
Check our LinkedIn Analytics tool here.
My top 3 LinkedIn analytics tools
My go-to for both personal and company pages. It pulls data in real time, shows hourly performance trends, and keeps all my profiles in one dashboard. I also like that it integrates with content planning and scheduling, so analytics and posting live in the same place.
- Shield
Popular with creators for its clean personal profile analytics. Offers hourly breakdowns, post-type comparisons, and export options. Works best for individuals rather than large teams.
- Keyhole
Strong on hashtag and keyword tracking, which can help if you run campaigns that need competitive monitoring. Supports both LinkedIn and other platforms, making it good for multi-channel reporting.
If you post casually, the free analytics might be enough. But if you rely on LinkedIn for lead generation or manage multiple accounts, investing in a paid tool allows you to save hours every month and make better decisions faster.
The 7 LinkedIn analytics bugs everyone complains about
After years of using LinkedIn analytics, I’ve learned that some issues are just quirks in how the data is presented, while others are genuine bugs that confuse even experienced users. Reddit and Quora are full of threads about the same frustrations, so if you’ve run into them, you’re not alone.
Here’s a table breaking down the most common problems, why they happen, and how I work around them.
Common Problem Why It Happens Proven Workaround Inconsistent metrics across views/exports The dashboard often shows a rolling 30-day view, while CSV exports list lifetime totals. Comparing them side-by-side will never match perfectly. For final reports, always use the CSV export as your single source of truth. Use the dashboard only for short-term performance checks. Engagement counts omit post clicks LinkedIn’s front-end “engagement” figure often leaves out post clicks, even though the engagement rate formula includes them. Track CTR separately by dividing clicks by impressions. Add UTM tags to all links and monitor them in GA4 for accurate click data. No native hourly analytics LinkedIn’s data refreshes daily, so you can’t see performance spikes by the hour. Use third-party tools such as Taplio or Shield to get hourly trends and optimize timing. Demographic data disappears for low-view posts LinkedIn hides audience demographics until a post reaches around 25 unique views, limiting insight on smaller posts. Push posts early via employee shares or use a small ad boost to cross the threshold quickly. Organic reach suddenly collapses Changes in LinkedIn’s algorithm, audience behaviour, or repetitive content formats can sharply reduce impressions. Test different formats (carousels, documents, videos) and adjust posting times based on historic engagement. Exported CSV numbers don’t match the front-end API latency means CSV exports can lag 24-48 hours behind dashboard data. Delay pulling final campaign reports by two days to ensure all metrics have updated. Can’t track multiple personal profiles easily LinkedIn has no built-in feature for consolidating analytics across multiple personal profiles. This is a major gap for agencies and consultants. Use Taplio or similar tools to track all personal and company profiles from one dashboard.
From my own experience, understanding why each bug happens is half the battle. Once I shifted to a process that combines CSV exports, GA4 tracking, and Taplio for the missing features, I stopped wasting hours reconciling numbers and started focusing on decisions that actually drive results.
My 4-step monthly workflow to pull LinkedIn data like a pro
Over the years, I’ve realised that pulling analytics is not only about “checking numbers.” It’s about building a routine that delivers consistent, reliable insights month after month. This is the exact workflow I use on the first week of every month to make sense of LinkedIn’s data, and turn it into a clear action plan.
- The Data Pull
On the 1st of each month, I export the previous month’s CSV file from LinkedIn. This is my clean, raw dataset. I don’t wait too long, but I also make sure I’m past the 48-hour API lag so numbers are final. This file becomes my baseline for all further analysis.
- The Reconciliation
Next, I compare the CSV totals to what the dashboard shows for the same date range. If there are discrepancies, I note them. Most of the time, these are small and explained by the 30-day vs lifetime difference. But occasionally, I find gaps worth flagging, especially in click counts. This is where having a “single source of truth” matters. For me, that’s always the CSV.
- The Funnel Check
LinkedIn analytics tell you what happened on the platform, but I also want to know what happened after people clicked. I open Google Analytics 4 and go to Acquisition > Traffic Acquisition. I filter by source/medium = linkedin.com / referral or linkedin / social to see traffic volume, engagement, and conversions from LinkedIn. This shows whether my posts are actually contributing to leads or sales.
- The Content Review
Finally, I look at my top three and bottom three posts from the month. I check what topics, formats, and posting times worked, and which fell flat. Sometimes a post with fewer impressions drives more clicks, which tells me it resonated with the right audience. This review directly shapes my content plan for the next month.
Bonus – Skip the Manual Work: Use Taplio for Instant LinkedIn Analytics
When I first created my monthly workflow, it worked. But it was still time-consuming. Exporting CSVs, cross-checking numbers, opening GA4, and digging into post performance could easily take an hour or more. That’s fine if you enjoy data crunching. But if your main focus is creating content and engaging with your audience, it’s not the best use of your time.
This is where Taplio’s LinkedIn analytics tool changes the game. Instead of juggling LinkedIn exports and multiple dashboards, I get all the key metrics in one place and in real time. I can see my engagement trends, top-performing posts, audience growth, and even the best times to post, without touching a spreadsheet.
The real advantage is speed. Taplio’s dashboard does the “data pull, reconciliation, funnel check, and content review” steps for me automatically. I can log in, check my stats in a few clicks, and immediately move on to planning or writing my next post.
How I make the most of my LinkedIn data
When I first started tracking my LinkedIn analytics, I treated it like a checklist: export the CSV, glance at a few numbers, and move on. It didn’t change much in how I created content. That changed when I started using the data to actually guide my decisions.
- Match metrics to my real goals
If my objective is lead generation, I focus on CTR, referral traffic, and conversions. A post with 500 likes but no clicks looks great on LinkedIn, but it’s useless for my pipeline. The first time I made this shift, I realised half my “top” posts were only vanity wins.
- Spot the patterns worth repeating
I compare my top and bottom posts each month. I look for the hooks, topics, and formats that work more than once. For example, I discovered that practical carousel posts outperform text-only updates almost every time with my audience.
- Understand who’s engaging
I check the industries, job titles, and seniority of my audience. The month I noticed a spike in senior decision-makers from my target sector, I doubled down on content tailored to them.
- Make reporting quick
I used to spend hours reconciling CSVs and GA4 data. Now, I use Taplio to see everything in one dashboard so I can go straight from insights to action.
LinkedIn analytics can feel messy at first, with inconsistent numbers, missing data and limitations that make it harder to get a full picture. Once you know where to find the right metrics, how to work around the platform’s flaws, and how to connect the data to your goals, it becomes a tool you can rely on to make informed decisions.
For me, the change came when I built a repeatable process: pulling the data, reconciling it, checking the funnel, and reviewing content performance. This moved my focus from chasing vanity metrics to creating posts that consistently reach the right audience and deliver measurable results.If you want reliable insights without the manual work, Taplio’s LinkedIn Scheduler & Writer gives you everything in one place. Use it to understand your performance, refine your content, and take your next LinkedIn post further than ever.
FAQ
Why are my LinkedIn analytics numbers different in the CSV export versus the dashboard?
The dashboard often shows a rolling 30-day view, while the CSV includes lifetime data. There can also be a 24-48 hour delay before all metrics update. For final reporting, the CSV is usually the more accurate source.
What is a good engagement rate on LinkedIn in 2026?
The overall average is around 5% for company pages, but it varies by industry and content type. Compare your results with relevant benchmarks and your own business goals.
How can I see LinkedIn analytics for my personal page?
Go to your profile and scroll to the analytics section. You can view profile views, post impressions and search appearances. For post-level data, open the post and click “View analytics.”
What is the best LinkedIn analytics tool?
It depends on your needs, but Taplio is a strong choice for real-time data, multi-profile tracking and integrated content planning.
How do I track conversions from LinkedIn on my website?
Add UTM parameters to your links, then review the data in Google Analytics 4 under Acquisition > Traffic Acquisition, filtering for LinkedIn as the source.
Why can’t I see the demographics for my post?
LinkedIn only shows demographics once a post reaches around 25 unique views.
How do I check my competitor’s analytics on LinkedIn?
On a company page, use the “Competitors” tab to compare follower growth and posting frequency. For more detailed insights, use a third-party tool or manual tracking.


Keep reading
All articlesRelated Articles


.avif)
Your Linkedin AI coach is waiting for you
Join 12,000+ creators who let their coach turn the blank page into a plan and watch their audience compound.
7-day free trial · 30 day money back · Cancel anytime
AVG. VIEWS
2,979
-1.5%
ENGAGEMENT
3.2%
+0.8%

Free Monthly Report
How does your LinkedIn compare?
Get free monthly benchmarks on reach, engagement, and content format performance.
Get the Benchmark