


2,847 creators joined this month
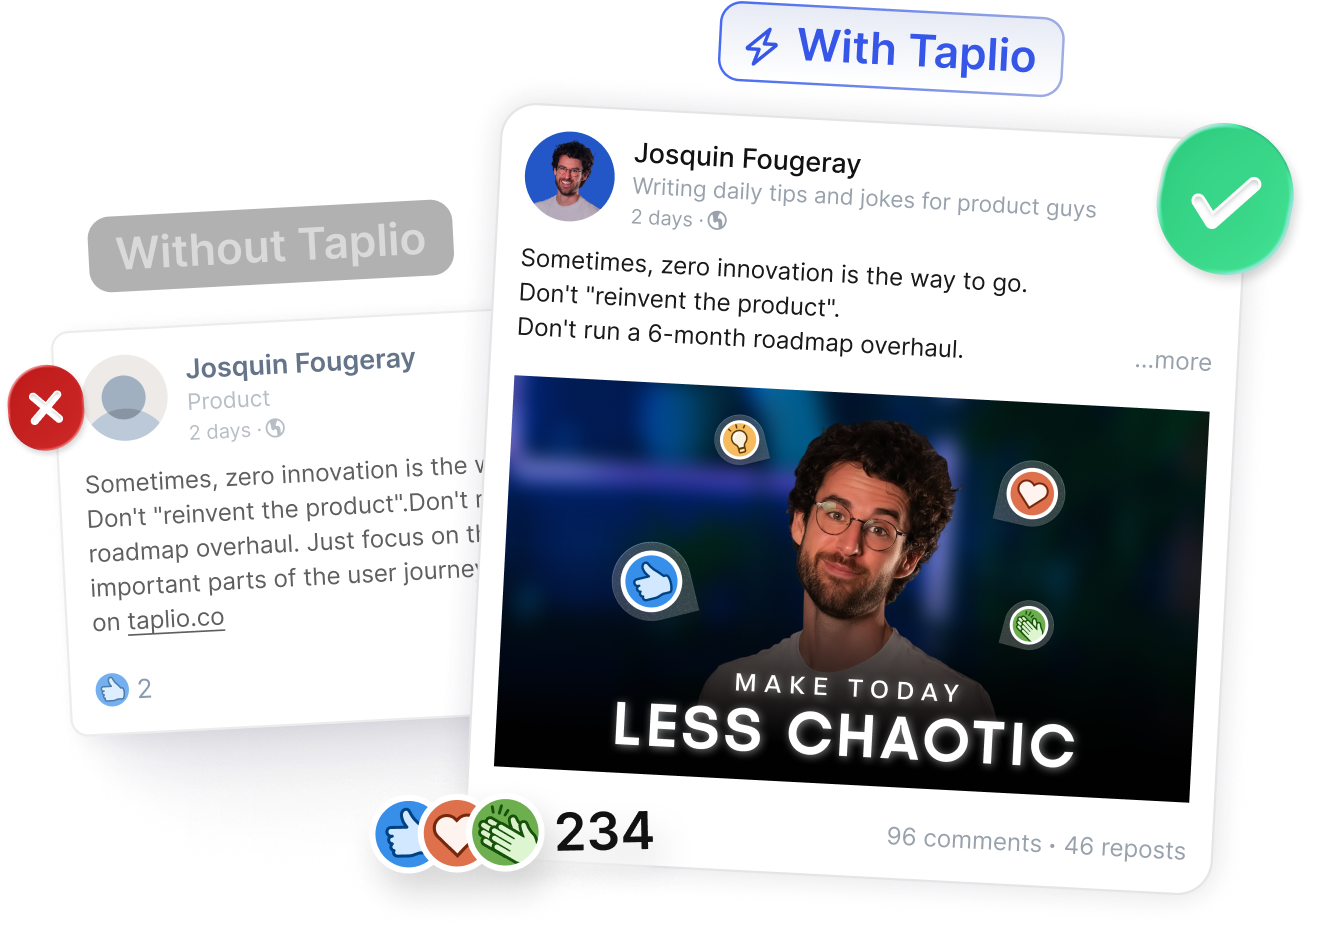
Grow your LinkedIn audience 3x faster
AI writing, carousel maker, scheduling, analytics, and lead finder. All in one tool.
Try Taplio for free7 day free trial - Money back guarantee

The statistic that changes how I evaluate every LinkedIn post we publish is 3.49%. Why?
Because our latest performance metrics met the 2% historical platform baselines, yet our inbound pipeline stayed completely flat. That misalignment forced me to face reality: we were judging our current distribution against outdated metrics, while the actual platform dynamics had moved on.
To fix our strategy, I pulled the raw data to see what it actually takes to perform in the current ecosystem and here is what I discovered.
Our latest data report from 219,456 posts reveals a massive shift in platform performance metrics. Many professionals feel stuck because their numbers do not match historical expectations. However, looking at the aggregate dataset, shows that old industry assumptions are wrong.
The data shows the true average LinkedIn engagement rate sits at 3.49%. However, I always warn people not to look at this number in isolation, because your audience size dictates your baseline. If you are still measuring your growth against the old 2% estimates, you are working with an obsolete formula.
The data proves that your engagement naturally declines as your follower count grows. For example, accounts with 1K-5K followers see the highest typical engagement at 2.34%. Once an account scales past 50K+ followers, that typical rate drops down to 1.66%.
To manage this drop-off and maintain steady performance, you can read our guide to get more LinkedIn engagement.
(Source: LinkedIn Benchmark 2026)
The data challenges common assumptions about content performance. Despite the massive industry hype around video, static and document formats drive better interaction numbers.
Length also directly impacts how users interact with your feed updates. Ultra-long posts (2000+ characters) drive the highest engagement at 2.56%. In contrast, short posts (0-200 characters) average just 1.53%.
(Source: LinkedIn Benchmark 2026)
To measure where your content actually stands against benchmarks, you need to use a consistent mathematical formula. The standard baseline calculation divides your total interactions by your total visibility.
Engagement Rate = (Total Engagements /Total Impressions) * 100
When calculating this figure, you must know what metrics to aggregate. I see many marketers skew their data by omitting hidden interactions. Your total engagement number must include all native reactions, text comments, public shares, and user clicks.
Reactions include every native icon from the standard Like to the Insightful or Funny responses.
Comments track both the initial remarks from your audience and your subsequent replies within the thread.
Shares include quick reposts and reposts with thoughts that distribute your content to secondary networks.
Finally, clicks account for crucial actions like link clicks, profile navigation, and "see more" expansions on long-form text.
To find these numbers manually, you need to navigate through your profile dashboard. I use this quick process to map out our raw performance data:
If pulling these numbers by hand gets tedious, a dedicated LinkedIn analytics tool tracks your engagement rate automatically over time and shows which posts move it.
If you want to skip manual spreadsheet calculations entirely, you can open our free LinkedIn engagement rate calculator tool to analyze your profile metrics instantly.
You need to shift your mindset regarding how you interpret your data. For years, I evaluated content based on pure percentages, treating the engagement rate as a definitive score of business success. That was a mistake. Instead, I now look at this metric strictly as a measure of content efficiency.
To understand why, look at how reach changes the value of your percentages. For example, I can publish a post that reaches 100 people and receives 10 likes. That gives me an amazing 10% engagement rate.
However, that asset is vastly less impactful for my business growth than a high-distribution post reaching 100,000 people with 1,000 likes, even though that larger post only shows a 1% engagement rate.
I always prioritize quality over quantity when auditing performance. To contextualize this shift in perspective, keep these key performance rules in mind:
When analyzing your feed, look past the raw percentage and evaluate the depth of the actual conversations happening in your comments section.

Instead of following generic social media advice, you need to rely on exact, platform-specific data points. I restructured our internal distribution workflow around these five precise, tactical changes to maximize our daily content performance:
(Source: LinkedIn Benchmark 2026)
When you look at your performance metrics, it is a mistake to treat every interaction as if it carries the exact same value. I categorize interactions based on how users interact with our updates. The LinkedIn algorithm tracks multiple distinct actions, and each one impacts your content distribution differently.
To get an accurate picture of your performance, you need to understand what happens behind the scenes when a user stops on your post.
This includes the standard Like, plus the Celebrate, Support, Love, Insightful, and Funny icons. While these are great for quick social proof, I consider them low-effort interactions. They require a single click from a user and signal basic approval to the algorithm, making them the baseline tier of feedback.
This is the highest-value interaction on the platform. When someone takes the time to type a text response, it signals deep audience resonance. The algorithm rewards this heavy user effort by pushing your post directly into the feeds of that commenter's network, drastically increasing your organic distribution.
There are two types here: an instant repost, which copies your post directly to another feed, and a repost with thoughts, which adds personal commentary on top. I prefer when users add their own thoughts, as it contextualizes the content for a new audience and drives higher-quality profile visits back to the original source.
This includes clicking your profile name, clicking "see more" to expand a long text post, clicking an image to enlarge it, or clicking an external link. Clicks are incredibly important because they directly increase your post's "dwell time", the amount of time users spend actively reading or looking at your content, which is a major ranking factor for feed distribution.
Tracking your LinkedIn engagement rate is a practical way to understand how efficiently your content connects with your target audience. I used to focus entirely on basic numbers, but shifting my perspective to analyze format data and real conversation depth completely transformed our results.
As the platform dynamics continue to evolve throughout 2026, you cannot afford to waste time running manual calculations on spreadsheets or launching posts without clear performance insights. You need reliable data to guide your distribution strategy.
To take total control of your growth, streamline your workflow, and access instant, deep analytics for your profile, start optimizing your content performance today by trying Taplio.
The average LinkedIn engagement rate sits at 3.49% based on our cross-platform analysis of 219,456 posts. However, this figure is highly dependent on your total follower tier and content format rather than being a fixed industry metric.
You calculate your engagement rate by taking your total interactions (the sum of all reactions, comments, shares, and clicks) and dividing that number by your total impressions. You then multiply that result by 100 to get your final efficiency percentage.
Your engagement rate typically drops as your audience scales due to distribution dilution. Smaller accounts generally maintain a highly targeted, active network of close connections, whereas larger follower bases introduce passive observers who view your content without actively interacting.
Images are statistically better for driving engagement on the platform. Our performance data shows that image posts pull a 2.77% median engagement rate, whereas video content trails behind at a 2.13% median engagement rate.
The 3-2-1 rule is a distribution framework used to balance your content mix and keep your feed high-quality. For every three pieces of industry content you share, you add personal commentary to two of them, and publish one completely original post from scratch.
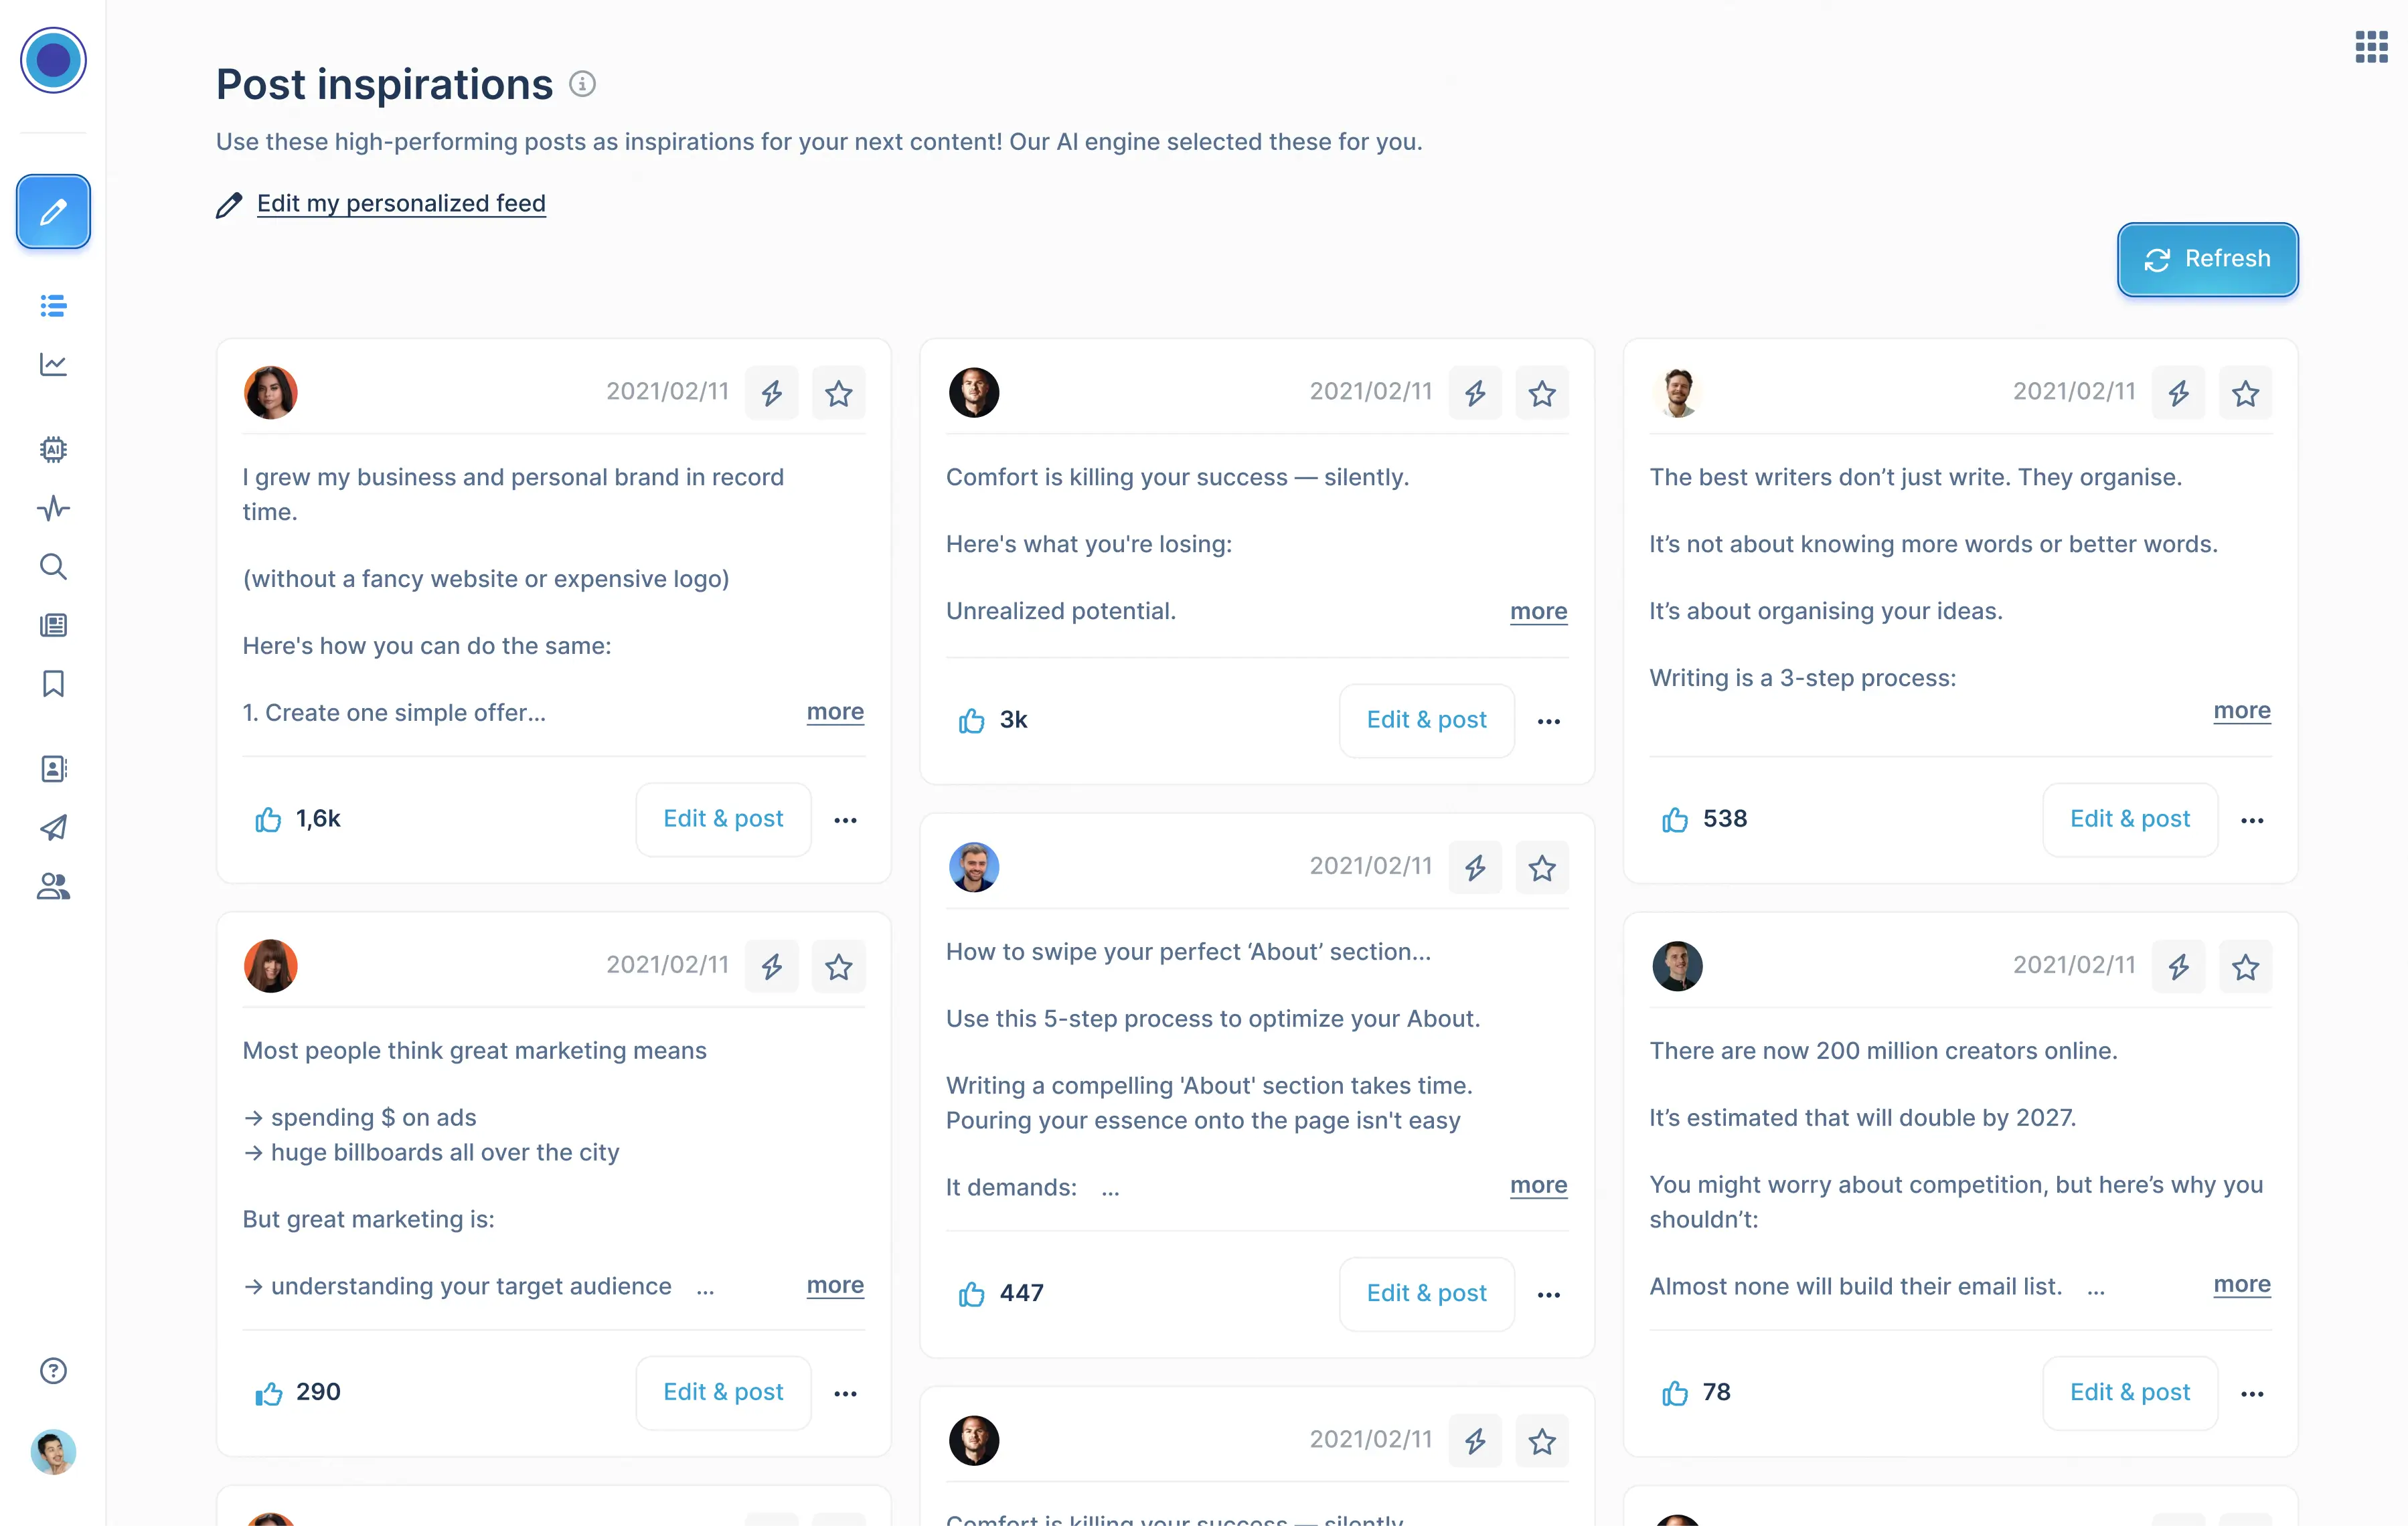
AI writing, carousel maker, scheduling, analytics, and lead finder. All in one tool.
Try Taplio for free
Get free monthly benchmarks on reach, engagement, and content format performance.
Get the Benchmark


.png)
